

Higher yields with lower correlation to public markets, with a focus on investment grade credit quality.
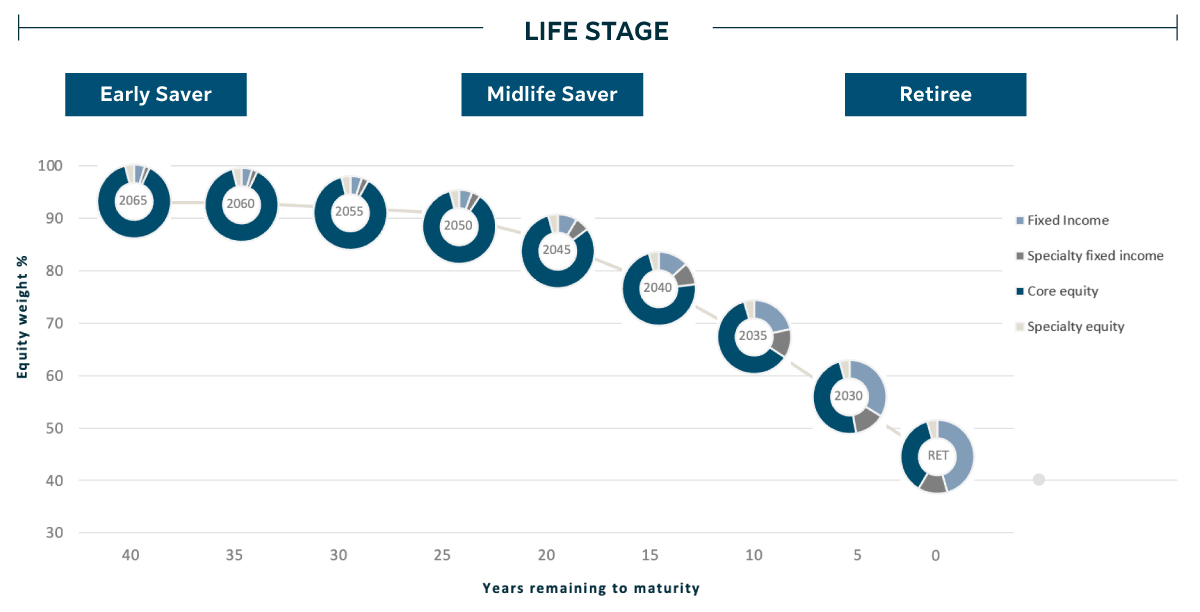
The glidepath chart displays nine pie charts representing different fund vintages as you progress toward retirement:
The leftmost pie shows approximately 90% equity and 10% fixed income, prioritizing long-term growth for anyone in the 2065 fund, or early in their career.
Each successive pie chart gradually shifts composition, with equity decreasing and fixed income increasing, reflecting a transition from growth-focused to balanced.
The rightmost pie charts show approximately 30-40% equity and 60-70% fixed income, emphasizing income generation and capital preservation for anyone in pre-retirement and retirement.
Moving left-to-right, colors representing equity fade while colors for fixed income grow more prominent, visually showing the shift from accumulation to retirement readiness.
Source: SLGI Asset Management Inc. For Illustrative purposes only. When a fund reaches maturity (end of July of the targeted year), it is closed to new subscriptions and future contributions are redirected to the corresponding Granite Retirement Fund. The assets in the maturing fund are automatically transferred to the corresponding Granite Retirement Fund after a 3-4 year period, providing flexibility and time for tax planning purposes.

