
U.S. Fed intensifies the fight against inflation with back-to-back rate hikes
As financial conditions tighten and the economy slows, we remain cautious on credit.
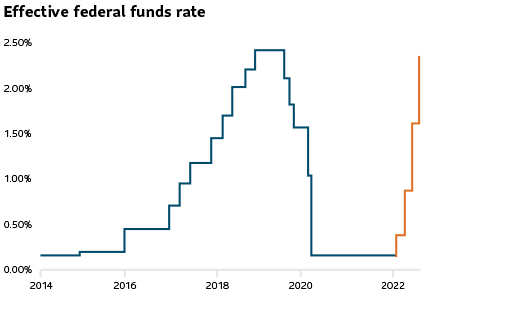
Embarking on one of the fastest monetary tightening cycles in decades, the U.S. Federal Reserve raised interest rates by 75 basis points in July for the second straight time. The Fed’s fight against record inflation has triggered over 225 basis points of rate increases since March of this year – a remarkable pace of tightening. To put it in perspective, this is the same magnitude of hikes delivered by the Fed over three years from 2015 to 2018.
Hints of more rate rises to come
The Fed has left open the possibility of another supersized rate rise at its next policy meeting in September. The central bank’s benchmark target rate range of 2.25% to 2.5% is only now in line with its estimated neutral rate of interest – a rate that neither stimulates nor restricts growth. Calling the current labor market as extremely tight and inflation much too high, Fed officials seem determined to move the benchmark interest rate above the neutral rate to over 3%.
The pace of hiking is hurting
Pointing to a recent softening in spending and production, the Fed acknowledged that its current pace of monetary tightening is slowing economic activity. We see the Fed’s monetary actions leading to tighter financial conditions. Other contributors include:
- The stronger U.S. dollar, which raises borrowing costs and hampers growth in emerging markets, had risen 16% in July from a year ago (as measured by the ICE U.S. Dollar Index).
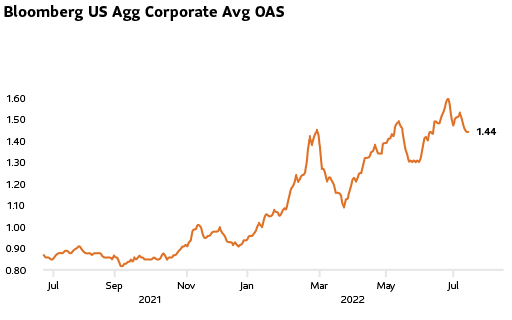
- Spreads for both investment grade and high yield bonds climbed in July to hit their highest levels for several months.
- Yield curve inversion - The 2-year Treasury yield exceeded that of 10-year bonds by 32 basis points. This is the widest spread in nearly two decades after the Fed’s interest rate hike in July.
We believe all these measures indicate rising challenges to growth over the next few quarters.
Maintaining our cautious stance to credit
Given the rising risks to growth, we are approaching credit with a lot of caution. We are underweight the riskier parts of credit that are most sensitive to rising rates including U.S. investment grade bonds. Additionally, with threats to global growth intensifying, we are also underweight emerging market, investment grade and global high yield bonds. On the other hand, we added higher quality core bonds to climb up the credit spectrum, as we believe these are better positioned to handle the challenges of the current interest rate hiking cycle.
Disclosure
This article contains information in summary form for your convenience, published SLGI Asset Management Inc. Although this article has been prepared from sources believed to be reliable, SLGI Asset Management Inc. cannot guarantee its accuracy or completeness and is intended to provide you with general information and should not be construed as providing specific individual financial, investment, tax, or legal advice. The views expressed are those of the author and not necessarily the opinions of SLGI Asset Management Inc. Please note, any future or forward looking statements contained in this article are speculative in nature and cannot be relied upon. There is no guarantee that these events will occur or in the manner speculated. Please speak with your professional advisors before acting on any information contained in this article.